
About
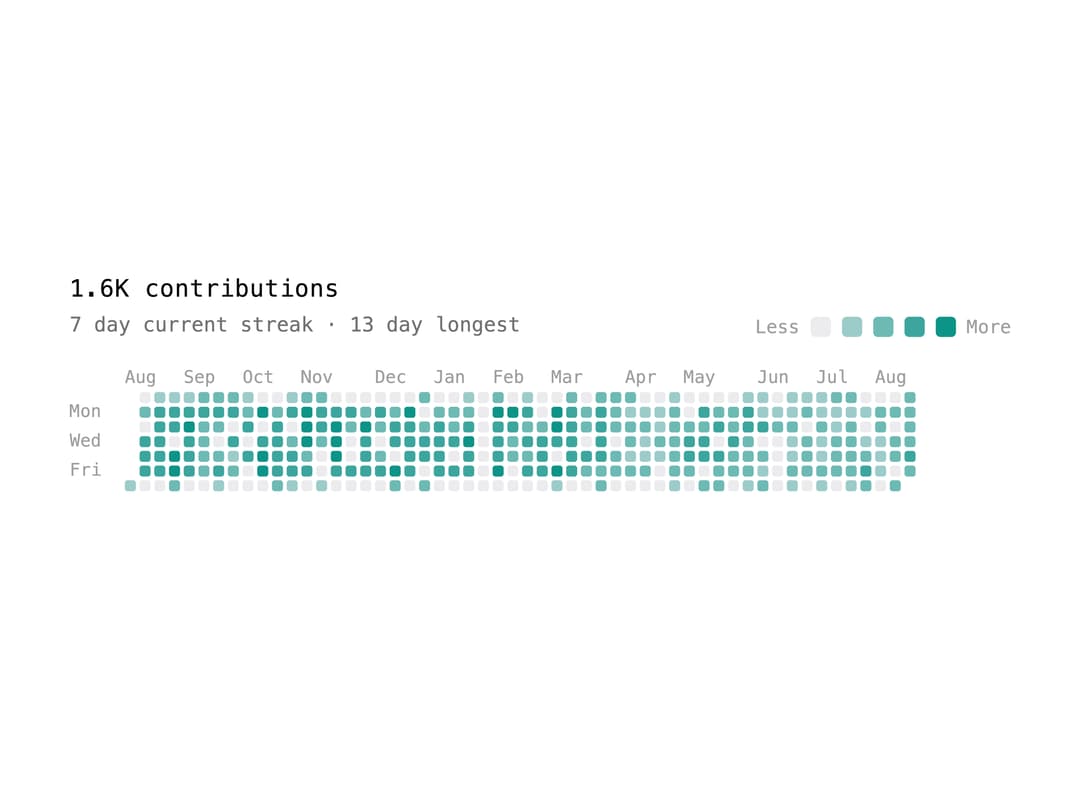
A GitHub-style contributions grid that visualizes a year of daily values as week columns with quantized color intensity, streak stats, and month labels.
Built with React and Tailwind. Copy the prompt and paste it into Claude Code, Cursor or Lovable: your agent adds Calendar Heatmap to your project and fits it to your theme.
Code
How Calendar Heatmap is used: the demo's code. The component's own source comes with a free account.
Usage.tsx
import CalendarHeatmap from "@/components/ui/calendar-heatmap";

export default function CalendarHeatmapDemo() {
  return (
    <div className="flex w-full max-w-xl items-center justify-center p-8">
      <CalendarHeatmap />
    </div>
  );
}
More by Arihant jain
View all
Footer section
1.9K
Multistep Form
714
Animated Drawer
695
Status Badge
521
Stacked Circular Footer
429
Input Modal
335
Large Name Footer
200
Profile Dropdown
197