Dashboard Components for React & Next.js
Build robust admin panels and analytics with 30 dashboard components, all crafted for React and styled with Tailwind CSS.
Browse components

Dashboard with Collapsible Sidebar
2.5K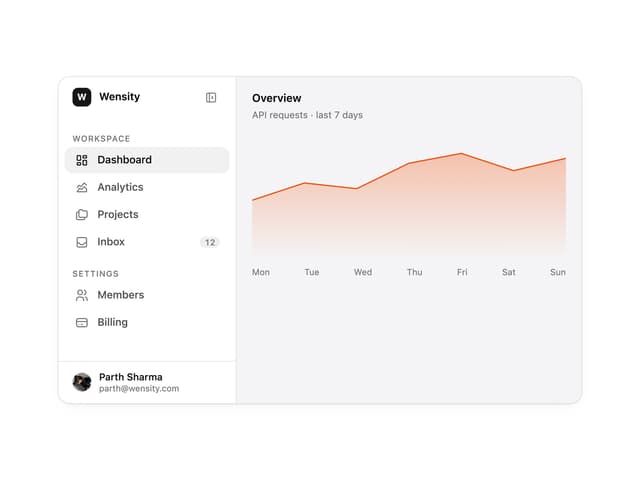

Sidebar
296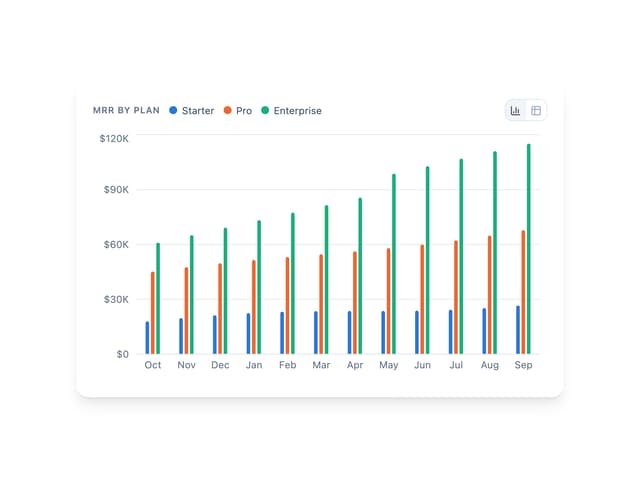
Bar Chart
3

SaaS Template
2.5K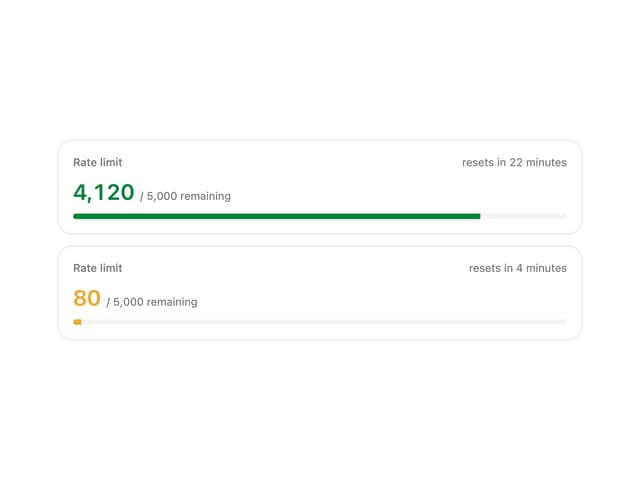
Rate Limit Meter
26

System Status Block
316

Chat template
620

Course Design Cards
1.1K
Stats Bento
1.1K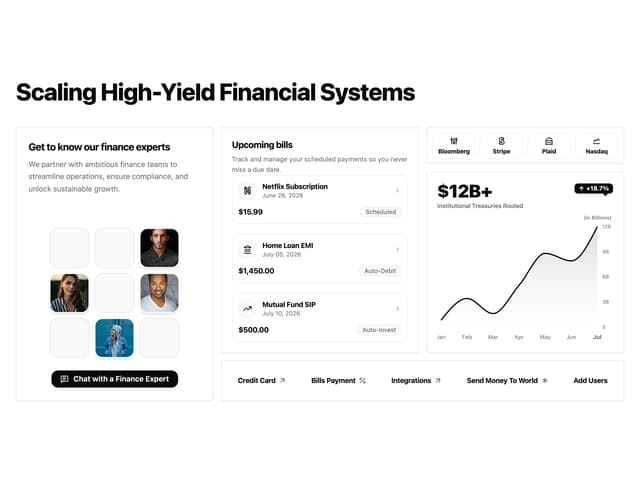

Financial Bento Grid
89

Feature Sections
357

Dashboard Stats Skeleton
13
Features Card
217
Stats cards with links
84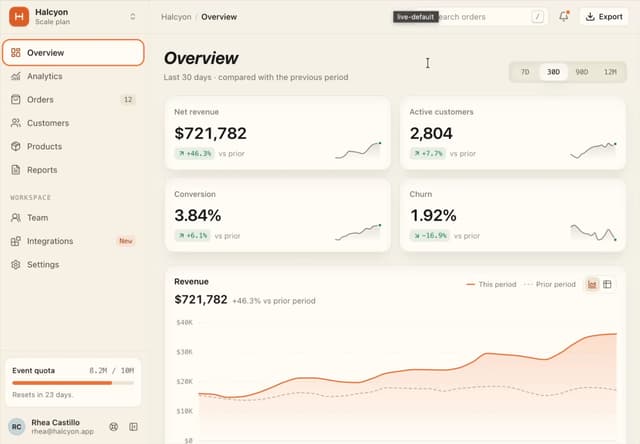
Dashboard Shell
30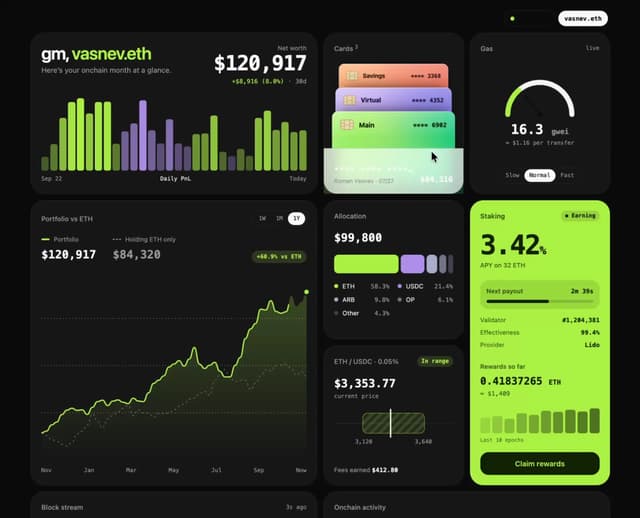

Web3Bento
599
Funnel Chart Big
138

Card
215

Statistics Card 7
301

HeroSectionWithGradient
351
Statistics Card 2
276
The Item one
6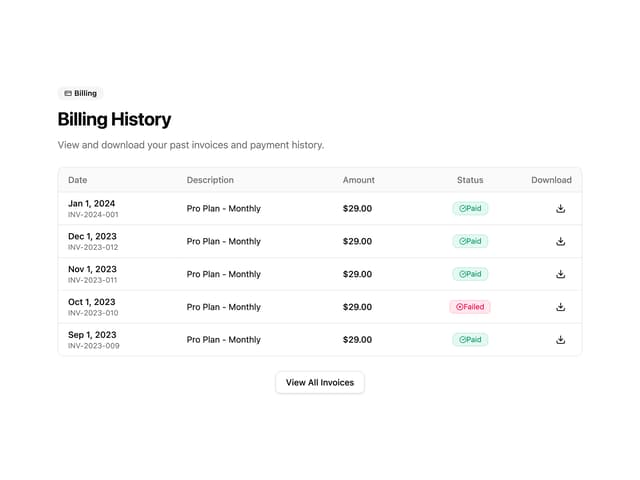

Invoice History Table
77
Table
97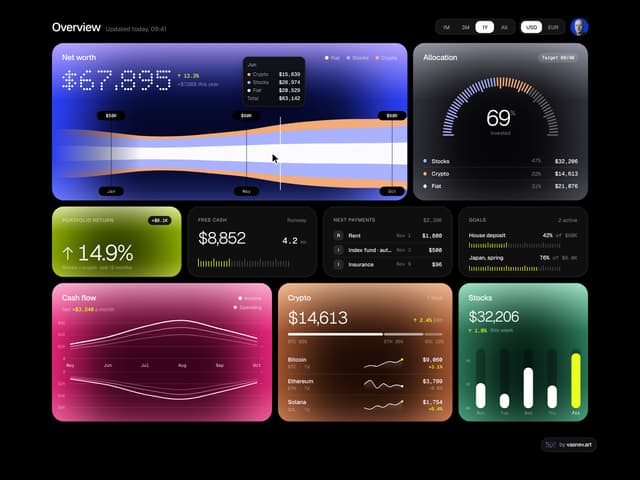
Finance Bento
893

Weather Card
59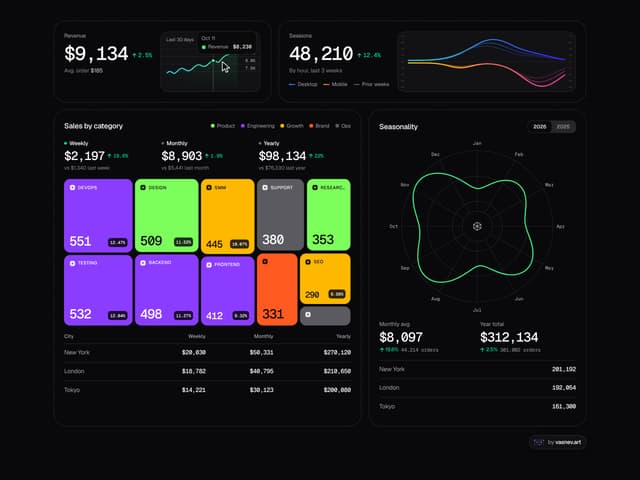
Analytics Bento
769

Sidebar
348
Data Grid Table
7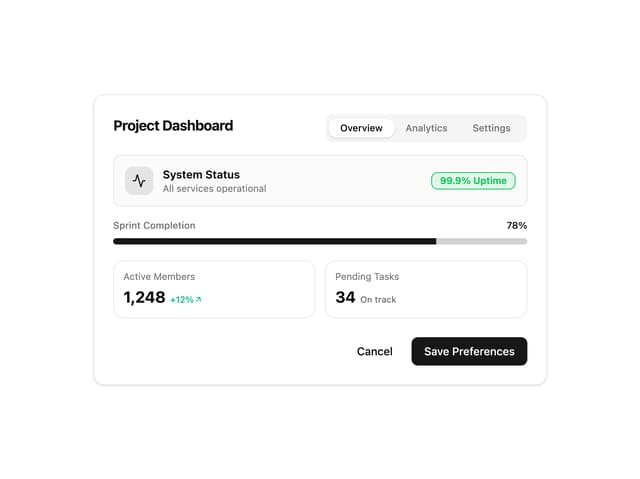
Card Tabs
110

Wallet Card 2
165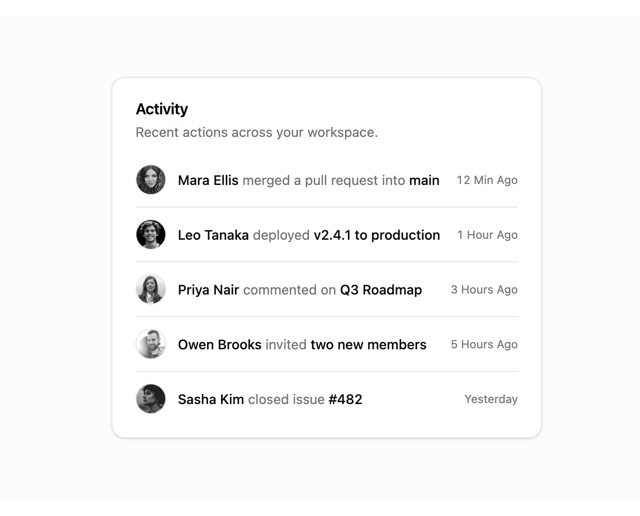
Recent Activity Card
34

Hero Section with Responsive Navigation
41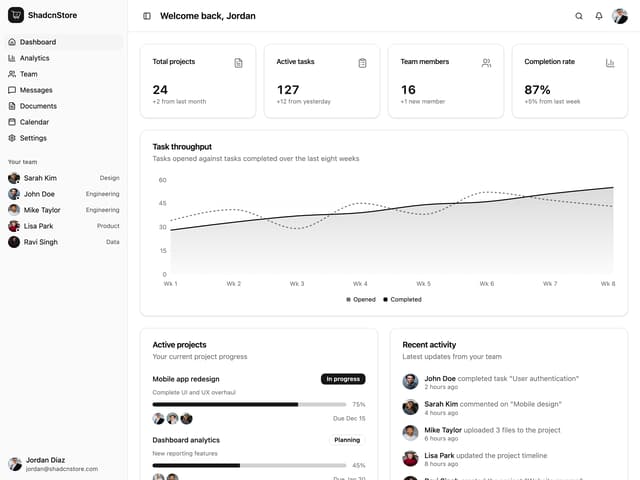

App Dashboard Layout
366

Area Chart
104
Advanced Stats
538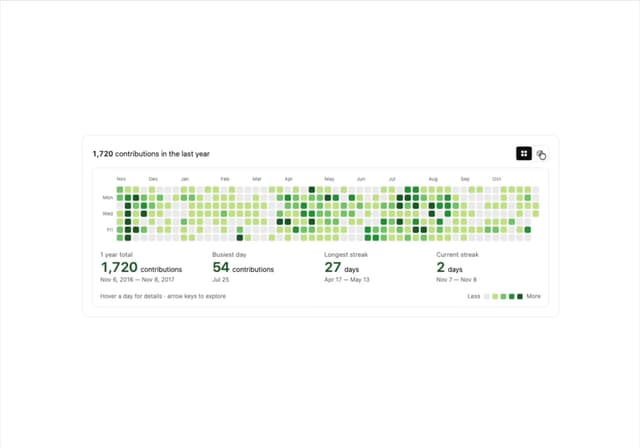

GitHub Contribution Graph 3D Heatmap
1.9K
ContributorsOverviewTable
107

Bar Chart
6

Funnel Chart
270
Dashboard Activities
119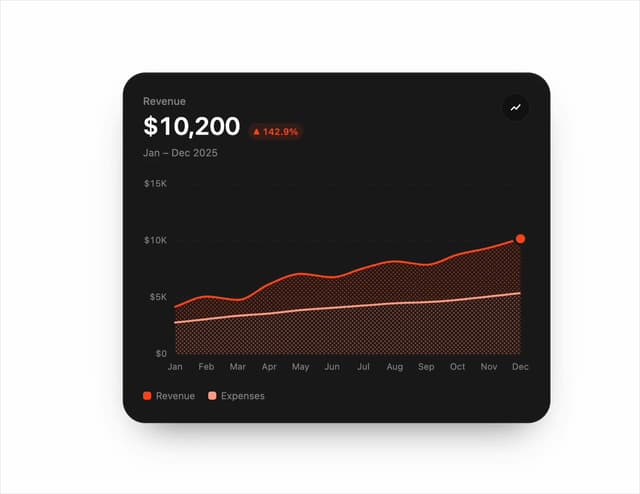
Chart Line
70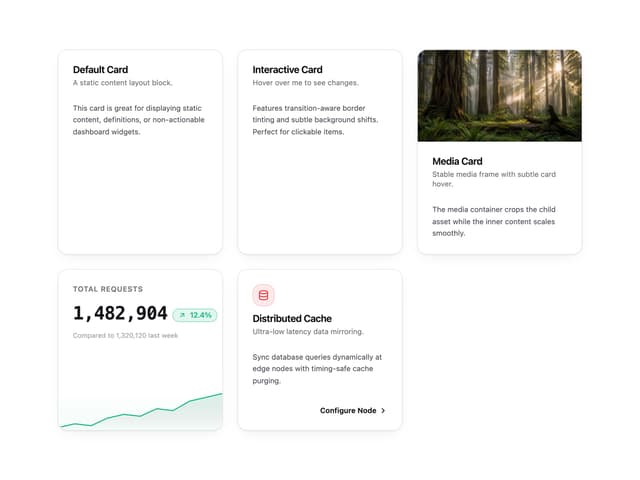
Card
23

Bento Dashboard
167
Statistics Card 10
272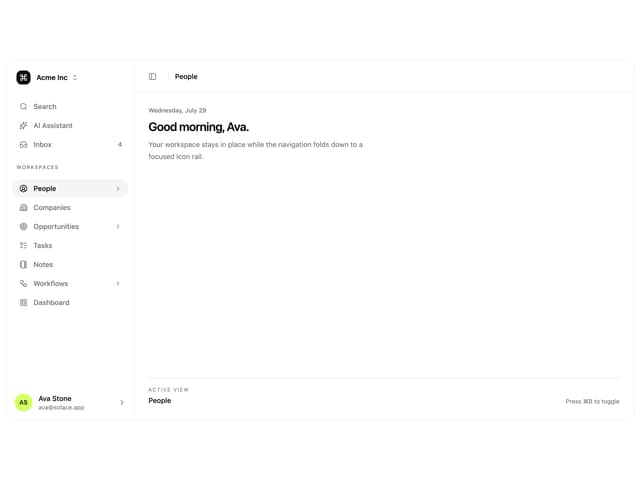
Animated Sidebar
211
Sidebar
3.7K

Pagination
5


Keep browsing with a free account
See all 12,000+ components, 354 templates, 955 themes and 138 apps, save favourites and copy two prompts a day for free. No card needed
More dashboard components
- Stats cards with links by Ephraim Duncan
- Stats cards with links by Ephraim Duncan
- Data Grid Table by Sean Hello
- Bar Chart by Intent UI
- Funnel Chart by bklitai
- EmptyState – Beautiful, Accessible ‘No Data’ States by Sonu kumar
- Animated Features Bento with Live Diagrams by Kedhareswer Naidu
- Table by Origin UI
- AI Agent Pipeline by Monolyth Dev
- Dashboard Sidebar by Arun Dass
- Stats Band by kuratlielia
- Metrics Board by aadilghani1
- Sparkline by appica-dev
- Orbit Ring Stats by ham7a311
- Financial Dashboard by Ravi Katiyar
- Crypto Dashboard by reuno-ui
- Empty Styled by ai 2
- Gradient Area Chart with Stripe Overlay by Sean Hello
- Number Ticker by Daniel Petho
- Charts & KPI Cards by Mohamed Uvaish
- Progress Metric Card by Mak VieSAinte
- Dashboard by Ravi Katiyar
- Uptime Card by Kokonut UI
- Nested Dashboard Menu by Ruixen
- Data Grid Table by Sean Hello
- Stats cards with links by Ephraim Duncan
- Funnel Chart by bklitai
- Crypto Dashboard by reuno-ui
- Simple UI by Le Thanh
- Weather Widget by vijayksingh
- Navbar by AliFarooqDev
- Server Card by Mohammad Shehadeh
- Area Chart with Glowing Dot Markers by Sean Hello
- Line Chart by Legion Dev
- Container Scroll Animation by Manu Arora
- Traffic Source Donut by Oliver
- Project Management Table by ShadcnSpace
- Crosshatch Area Chart by Sean Hello
- Fullscreen Calendar by Ahmed Mayara
- Donut Chart by Ravi Katiyar
- Project Data Table by Ravi Katiyar
- Dashboard by Ravi Katiyar
- Bar Chart by Legion Dev
- Pie Chart by Legion Dev
- ZoomDepthTabs by Ruixen
- Navbars by Arihant jain
- Dark Theme Icon by Campsite
- FeaturedCrmDemoSection by Ruixen
- Data Grid Table by Sean Hello
- Funnel Chart by bklitai
- Stats cards with links by Ephraim Duncan
- Line Charts 9 by Sean Hello
- Weather Widget by vijayksingh
- Revenue Bars Chart by Oliver
- Sidebar with Search and Profile by uiable
- Line Graph Statistics by Ravi Katiyar
- Audit Log Table by Arihant jain
- Bar Race Chart by DHxWhy
- Sidebar Dashboard Skeleton by Cnippet
- Incident Report Large by REAVIZ
- Bar Chart by Legion Dev
- Hour Dial Stats by ham7a311
- Warped Circle Transition by Edu Calvo
- Swapy Draggable Card by ui layout
- Auth Section 3 by solaceui
- 8-bit Stats Dashboard by OrcDev
- Bar Chart by heygaia
- Departures Board by flightcn
- Dashboard Overview by Sonu kumar
- Floating Panel by Abraham
- Hero 2 by Preet Suthar
- Sidebar with Browser like Tabs by Arunachalam
- Data Grid Table by Sean Hello
- Funnel Chart by bklitai
- Settings Sidebar Layout by felipemenezes098
- Sidebar Light by inference-sh
- Chart by Wensity Labs
- Timesheet Confirmation by Ravi Katiyar
- Line Chart by Legion Dev
- Radar Score Chart by Sean Hello
- Builder OS Bento by Drew Sepeczi
- Donut Chart With Center Stats by Sean Hello
- Wheel Pagination by Ruixen
- Animated Bar Chart by mirukullacode
- Minimisable Table by Ruixen
- Stats Card by Kavi Katiyar
- Bar Chart by Legion Dev
- GitHub Activity Grid by Wensity Labs
- Draggable Grid Dashboard by ui layout
- KPI Tile by OSAGI
- Usage Dashboard by Mohammad Shehadeh
- Conversion Funnel Area Chart by Ahmed Mayara
- Glare Cards by Daiwiik Harihar
- Line Chart by kuratlielia
- Sidebar by Andrew Luo
- Banner by Fuma Nama
- Data Grid Table by Sean Hello
- Funnel Chart by bklitai
- Lighthouse Scores Radial Chart by Sean Hello
- Builder OS Bento by Drew Sepeczi
- Donut Chart With Center Total by Sean Hello
- Trend Card by Ravi Katiyar
- Event Dashboard Hero by anelkabag
- Bar Chart by Legion Dev
- Insight Cards by Arihant jain
- Weekly Fitness Card by ShadcnSpace
- Featured Section Stats by Ruixen
- Card Frame Table by Cnippet
- Progress by Kavi Katiyar
- Animated Hero by KinfeMichael Tariku
- Hour Dial Stats by ham7a311
- Incident Report Middle by REAVIZ
- Aurora Flow Chart by nikolas-sapa
- Bento Product Features by Kavi Katiyar
- Visualize Booking by LN
- Featured Image Section by Ruixen
- Data Refresh State by Mehi
- projects-table by LN
- Floating Panel by Abraham
- Chrono Board by Dhileep Kumar GM
- Data Grid Table by Sean Hello
- Bar Chart by Legion Dev
- Line Charts 5 by Sean Hello
- Hero 195 by Shadcnblocks.com
- User Table by alain00
- Leads Data Table by Isaiah
- Allocation Sankey Chart by Legion Dev
- Features by Méschac Irung
- Active Users Area Chart by Oliver
- Area Chart Analytics Card by Ahmed Mayara
- API Key Manager by Kiki
- Area Chart by Legion Dev
- Line Charts 6 by Sean Hello
- Task List Card by tailwind-admin
- Layered Chart XL by REAVIZ
- Tabs Component by Abraham
- Grouped Bar Chart by Isaiah
- Content Block by Méschac Irung
- Stats Card by Ravi Katiyar
- Token Usage Collapsible by ShadcnSpace
- Category Bar Chart by Ahmed Mayara
- settings by LN
- Earnings Donut Chart by ShadcnSpace
- NotificationIn box Popover by Ruixen
- Data Grid Table by Sean Hello
- Line Charts 1 by Sean Hello
- Line Charts 4 by Sean Hello
- Area Chart by Arihant jain
- Hero Section by Mikolaj Dobrucki
- InlineAnalyticsTable by Ruixen
- Stocks Dashboard by Moumen Soliman
- TerminalBentoGrid by Dhileep Kumar GM
About dashboard components
This collection gathers 83 dashboard components for building admin panels and analytics views. You get stat tiles, chart cards, data tables, sidebars, activity feeds, and full page shells that tie them together. Styles cover clean SaaS admin looks, dense data-heavy layouts, and developer-oriented consoles. Whether you are assembling a category management view or a software development dashboard, these give you the building blocks and full layout examples to start from.
Compose a shell from a sidebar and a top bar, then drop stat cards and charts into the main grid. Each component is React with Tailwind CSS and slots into a Next.js app route without extra wiring. Copy the TSX, install via the shadcn CLI using the registry URL, or pull one through the Magic MCP from Cursor or Claude Code. Preview the layout live, then connect your own data source.