
About
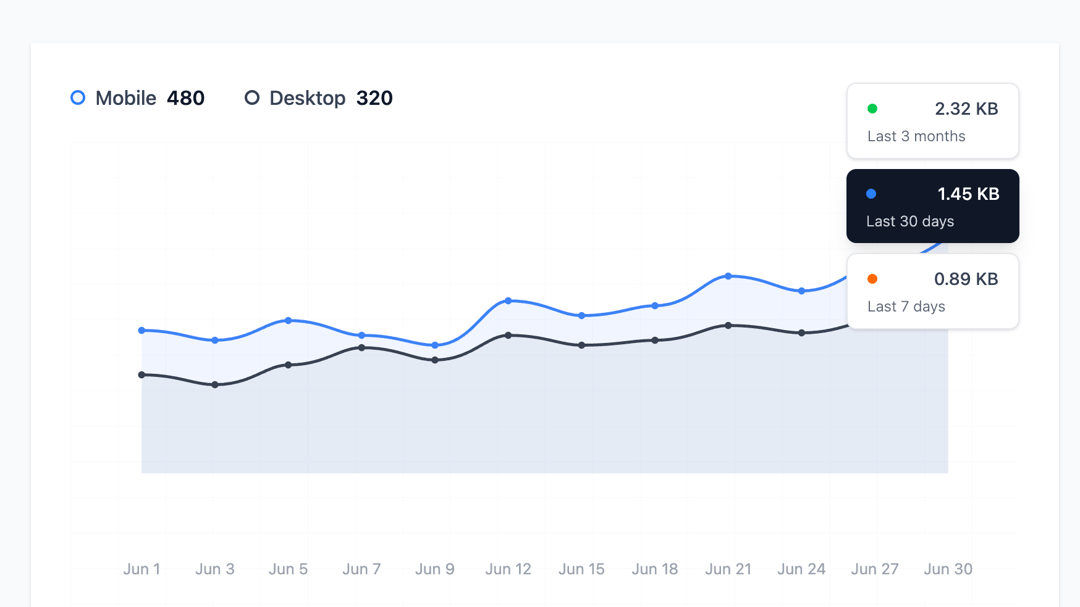
This UI displays mobile vs desktop usage trends over June, with mobile consistently higher. A sidebar lets users toggle data for the last 7 days, 30 days, or 3 months.
Built with React and Tailwind. Copy the prompt and paste it into Claude Code, Cursor or Lovable: your agent adds Line Graph Statistics to your project and fits it to your theme.
Code
How Line Graph Statistics is used: the demo's code. The component's own source comes with a free account.
Usage.tsx
import CleanWireframeAnalytics from "@/components/ui/line-graph-statistics";

export default function DemoOne() {
  return <CleanWireframeAnalytics />;
}
More by Ravi Katiyar
View all

Animated Shader Hero
3.7K
Hero
3.2K
Circular Gallery
2.8K
Minimalist Hero
2.6K
Floating Icons Hero Section
1.9K
Glass Calendar
1.9K
Feature Carousel
1.7K
AI Image Generator Hero
1.4K
More in Cards
View all

Course Design Cards
1.1K

Interactive Tech Stack Bento Grid with Hover Effects
260
Stats cards with links
125

Statistics Card 2
277

Weather Card
60
The Item one
3
Statistics Card 10
272
Statistics Card 7
302
