
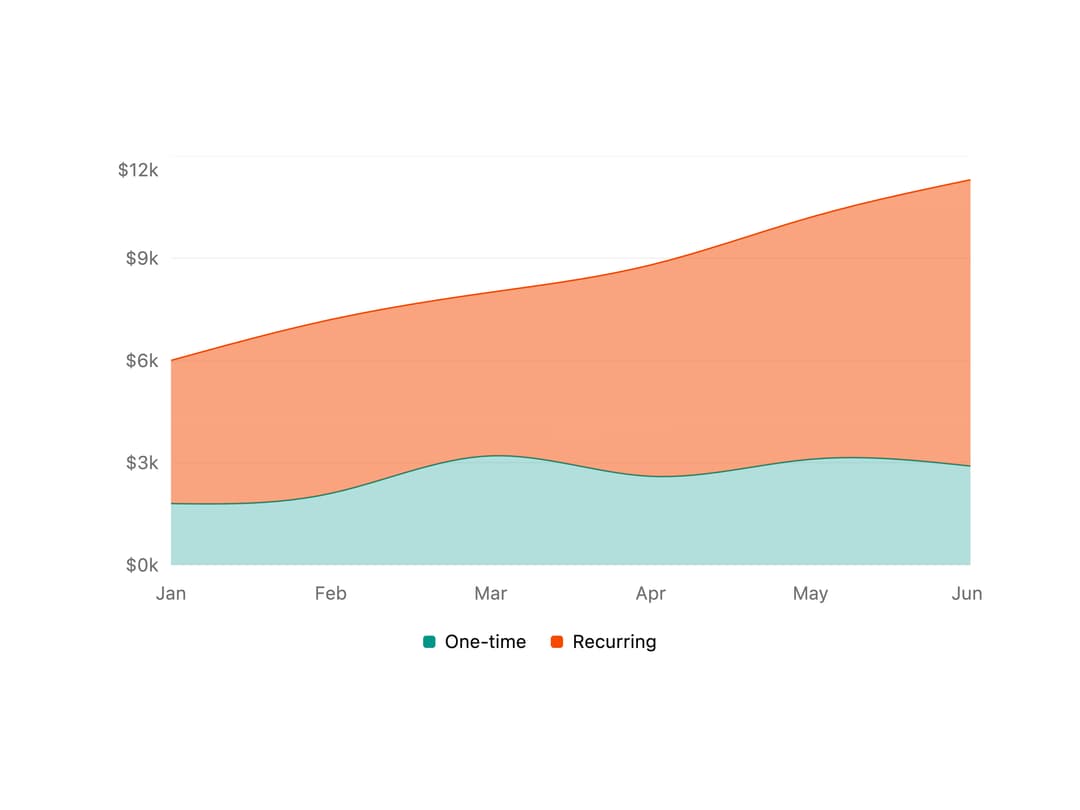
About
A stacked area chart that visualizes two revenue series (one-time vs recurring) over time with a Y-axis legend and tooltip.
Built with React and Tailwind. Copy the prompt and paste it into Claude Code, Cursor or Lovable: your agent adds Stacked Revenue Area Chart to your project and fits it to your theme.
Code
How Stacked Revenue Area Chart is used: the demo's code. The component's own source comes with a free account.
Usage.tsx
import Pattern from "@/components/ui/v-chart-11";

export default function Demo() {
  return (
    <div className="w-full max-w-xl">
      <Pattern />
    </div>
  );
}
Dependencies
More by Cnippet
View all

Team
1.3K
Davincho Hero-1
686
Aero Hero-3
580
Features
515
Random Letter Swap Navigation
503
Services with Animated Hover Modal
470
Blogs
398
Aero Hero-1
364
More in Dashboards
View all
Dashboard with Collapsible Sidebar
2.5K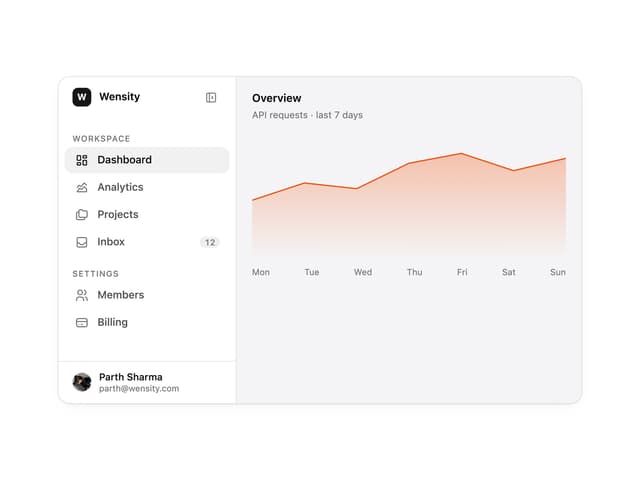

Sidebar
296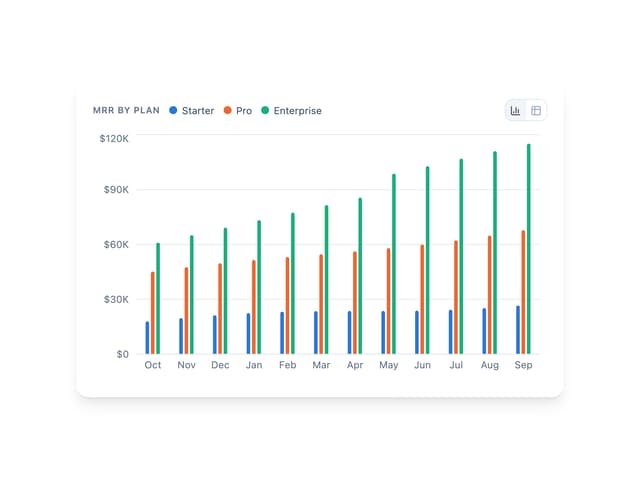
Bar Chart
3

SaaS Template
2.5K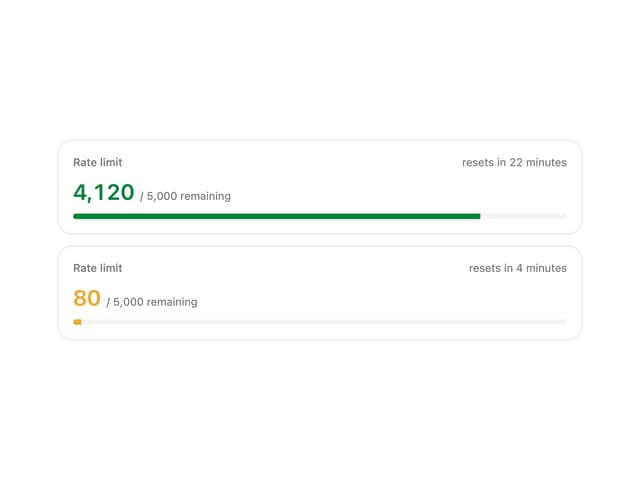
Rate Limit Meter
26

System Status Block
317

Chat template
620

Course Design Cards
1.1K


