
About
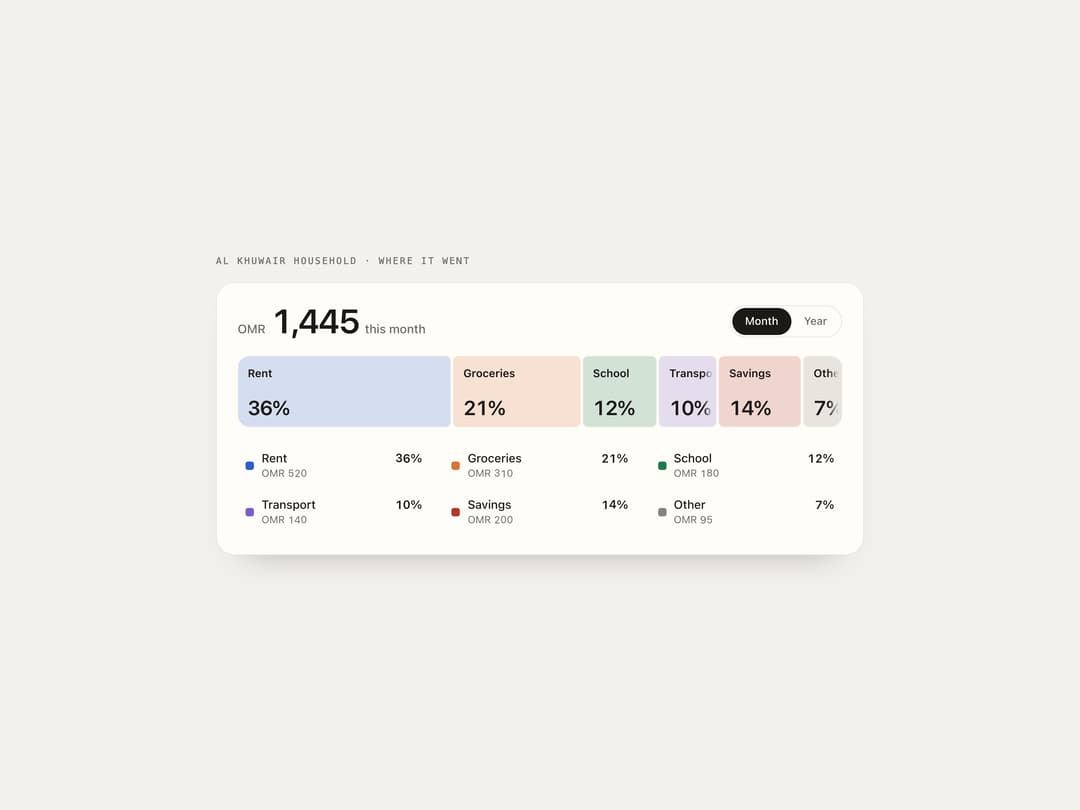
A single flex bar that breaks a total into labeled shares, where hovering or focusing a share widens it, floods it with its color from the pointer's entry side, and rolls the numbers when you switch between periods like month and year.
Built with React and Tailwind. Copy the prompt and paste it into Claude Code, Cursor or Lovable: your agent adds Split Bar Stats to your project and fits it to your theme.
Code
How Split Bar Stats is used: the demo's code. The component's own source comes with a free account.
Usage.tsx
"use client";

import SplitBarStats from "@/components/ui/split-bar-stats";

export default function Demo() {
  const c = ["#2f5fd0", "#d9733a", "#1f7a4d", "#7c5cc4", "#b4372a", "#8a8377"];
  return (
    <div className="flex min-h-full w-full items-center justify-center px-4 py-12 bg-[#f3f1ec] text-[#1b1a17]">
      <div className="w-full max-w-3xl">
        <p className="mb-4 font-mono text-[11px] uppercase tracking-[0.16em] text-[#6f6a62]">
          Al Khuwair household · where it went
        </p>
        <SplitBarStats
          theme="paper"
          label="Household spending"
          periods={["Month", "Year"]}
          shares={[
            { label: "Rent", values: [520, 6240], color: c[0] },
            { label: "Groceries", values: [310, 3480], color: c[1] },
            { label: "School", values: [180, 3150], color: c[2] },
            { label: "Transport", values: [140, 1560], color: c[3] },
            { label: "Savings", values: [200, 1900], color: c[4] },
            { label: "Other", values: [95, 1420], color: c[5] },
          ]}
        />
      </div>
    </div>
  );
}
More by ham7a311
View all
Wave Mesh
79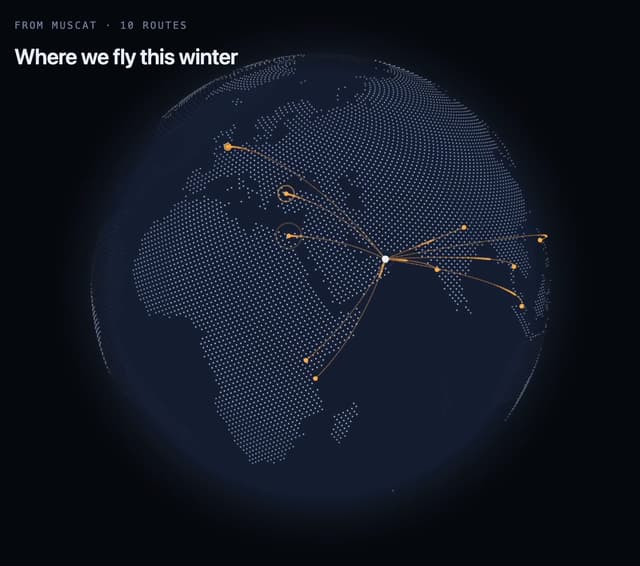
Route Globe
78
Glass Tiles
64
Glyph Swell
27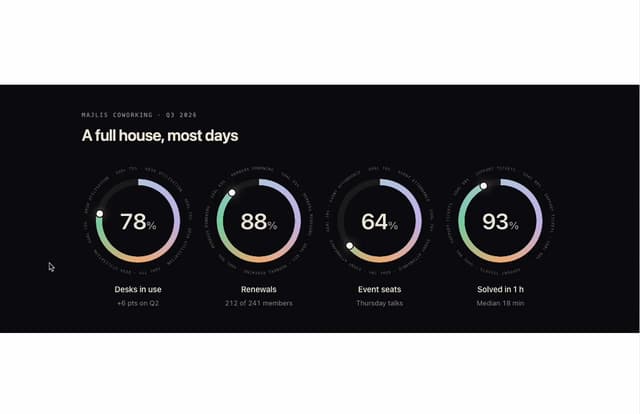
Orbit Ring Stats
26
Ask Bar
21
Wind Map
18
Streak Field Stats
17